SK hynix Sells Memory, a Commodity. It Earns Most When Memory Runs Short.
SK hynix earns on the gap between the price of memory and its cost per bit, a gap that widens when buyers want more memory than the makers can supply. Watch DRAM average selling price against DRAM bit shipments.
In one line: SK hynix earns on the gap between the price of memory and its cost per bit, a gap that widens when buyers want more memory than the makers can supply. Watch DRAM average selling price against DRAM bit shipments.
At a glance
- Latest: DRAM bit shipments about +10% and DRAM average selling price up in the high 20s percent in July–September 2026 from the quarter before, with DRAM shipments expected to grow in the mid-20s percent in October–December
- Biggest risk: new factories at SK hynix and its rivals adding memory faster than buyers need it, and slower spending on AI servers
- Reports: Quarterly. Next results: see Earnings Dates.
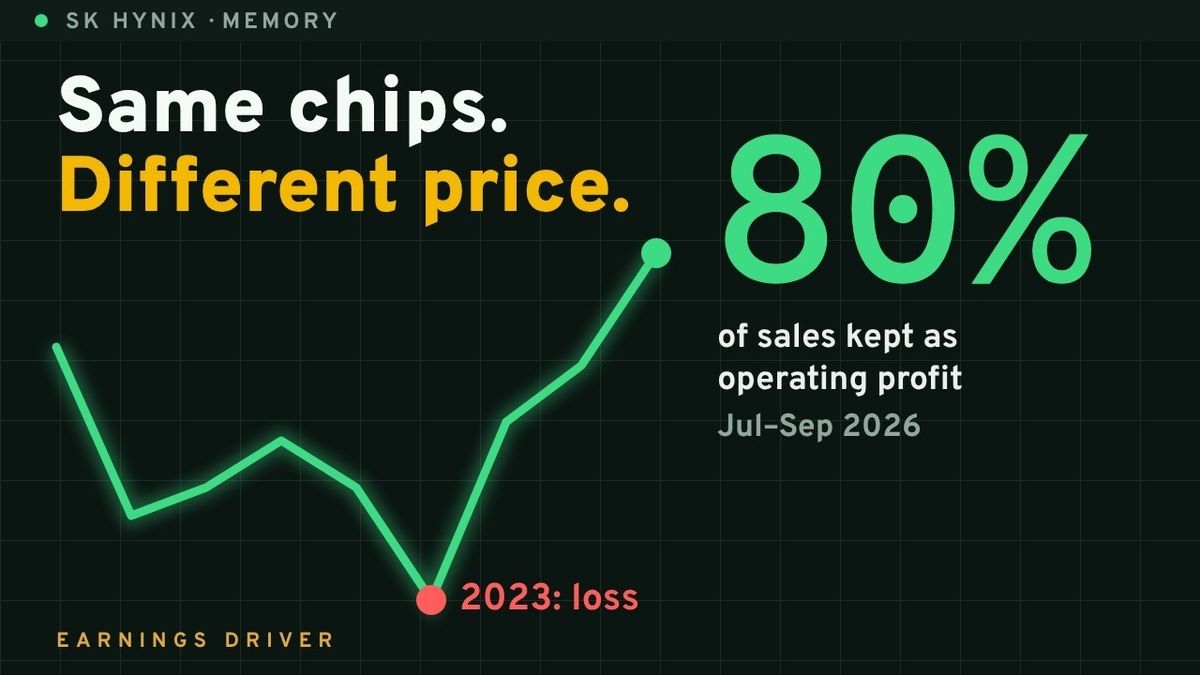
On October 28, 2026, SK hynix reported revenue of 104.6 trillion won (about US$74 billion) for July–September 2026. That is more than its revenue for all of 2025, 97.1 trillion won (about US$68 billion). In 2023, SK hynix had an operating loss of about 7.7 trillion won (about US$6 billion). Selling more memory does not explain how SK hynix kept 83.3 trillion won (about US$59 billion), 80% of its July–September revenue, as operating profit. That was also more than its operating profit for all of 2025, 47.2 trillion won (about US$33 billion).
What it sells vs. what it earns on
SK hynix makes two kinds of memory chips. DRAM holds the data a processor is working on, in servers, PCs and phones. NAND flash keeps data when the power is off, in solid-state drives (SSDs). In January–March 2026, DRAM made up 77.3% of SK hynix's revenue and NAND 22.0%, according to its US listing document (Form F-1/A).
Its chip factories are in Icheon and Cheongju in South Korea and in Wuxi and Dalian in China. As of October 2026, SK hynix is building a cluster of factories in Yongin, South Korea, and a plant in Indiana to assemble memory for AI chips.
SK hynix ranked second in DRAM revenue and first in HBM revenue in April–June 2026.
Table 1 — Shares of world DRAM and HBM revenue, April–June 2026
| Maker | DRAM | HBM |
|---|---|---|
| Samsung | 38% | 33% |
| SK hynix | 25% | 50% |
| Micron | 24% | 18% |
Source: Counterpoint Research (September 2026 update). HBM is counted within DRAM. CXMT holds about 10% of DRAM; other makers hold the rest.
Standard DRAM is built to industry standards set by JEDEC, a standards body. Once a server maker has tested and approved each maker's chips, it can use DRAM from Samsung, SK hynix or Micron in the same slot, so buyers choose largely on price.
A memory factory takes years to build. When prices are high, the large makers all build, and the new supply arrives years later, often at the same time. After memory prices fell in 2019, SK hynix's operating profit fell 87%. From October 2022 to September 2023, as demand for PCs and phones fell, SK hynix lost money for four quarters in a row.
What a bit of memory costs to make does not depend on what it sells for. From April–June to July–September 2026, SK hynix's revenue rose 25.3 trillion won and its operating profit rose 22.8 trillion won (about US$18 billion and US$16 billion at July–September exchange rates). About 90% of the added revenue became added operating profit (our calculation).
SK hynix shipped about 10% more DRAM bits at a price up in the high 20s percent, which points to DRAM revenue more than a third higher than in April–June (our calculation). Total revenue rose 32%. SK hynix did not give the DRAM–NAND split for July–September.
SK hynix's best-known product is high-bandwidth memory (HBM): DRAM chips stacked up to 16 high and placed beside an AI processor, such as one of Nvidia's. Stacking them with few defects is hard, and each customer tests and approves each maker's HBM before buying it. HBM sells for more per bit than standard DRAM. Most HBM demand comes from a few large companies building AI servers. SK hynix sets HBM volume and prices with its major customers a year ahead, rather than at market prices.
Buyers have also signed long-term agreements for memory of all kinds. In October 2026, SK hynix said agreements with 14 customers cover more than 50% of its total production capacity for 2027 and 2028. Prices under them move with the market within agreed ranges.
In October 2026, SK hynix said it expects demand for memory to exceed supply through 2030. AI servers use large amounts of standard DRAM and SSDs as well as HBM, and makers have moved capacity to HBM, according to TrendForce, a market research firm.
SK hynix expects capital spending in the high 40 trillion won range in 2026 (more than US$30 billion), and said in October 2026 that 2027 spending would be significantly higher. Micron expects first wafers from a new DRAM factory in Boise, Idaho, around mid-2027. Samsung expects to start production at a new memory factory in Pyeongtaek, South Korea, in 2028, according to The Elec, a Korean trade publication.
What moves the profit
Operating income ≈ Bit shipments × (Average selling price − Cost per bit) − R&D and overhead
- Bit shipments. The amount of memory sold, counted in bits, for DRAM and NAND separately.
- Average selling price. What SK hynix gets for each bit, averaged across its products. A larger share of HBM raises it even when market prices stay the same. SK hynix gives the changes in bit shipments and average selling price from the quarter before on its earnings calls. It does not disclose HBM's share of revenue as a number, but says which HBM generation leads its shipments.
- Cost per bit. What making each bit costs. Not disclosed. It shows in the operating margin. It falls as SK hynix moves to newer processes that fit more bits on each wafer.
- R&D and overhead. Spending on the next process generation, and on running the company.
Reading the earnings: what to watch, and how
SK hynix's results, earnings call materials and US filings (Form 6-K) are at skhynix.com and on SEC EDGAR.
- DRAM bit shipments against DRAM average selling price. Read it: a price that keeps rising while shipments grow means memory is still short. A price that rises more slowly while shipments keep growing can mean memory is becoming less scarce, or that long-term agreements are holding prices down. Latest: about +10% and high 20s percent in July–September 2026, from the quarter before.
- NAND bit shipments and average selling price. Read it: as with DRAM. NAND is the smaller part of revenue, so it moves the total less. Latest: shipments slightly lower and price up in the mid-20s percent in July–September 2026, from the quarter before.
- Operating margin. Read it: compare it with past peaks. SK hynix's operating margin was above 50% for the full year 2018, the year memory prices peaked. Latest: 80% in July–September 2026, against 76% in April–June 2026 and 47% in July–September 2025.
- Capital spending. Read it: spending rising at the large makers at once adds supply two or three years later. Latest: high 40 trillion won range (more than US$30 billion) expected for 2026, and significantly more in 2027.
- Capacity under long-term agreements. Read it: a larger share means more of SK hynix's volume keeps its price within the agreed ranges if market prices fall. Latest: more than 50% of 2027 and 2028 capacity, with 14 customers, as of October 2026.
Leading indicators (outside SK hynix's filings)
- DRAM contract prices. What PC, phone and server makers pay memory makers, surveyed by TrendForce. (price)
- When: forecasts for each quarter, updated monthly. Where: TrendForce.
- Latest: on September 30, 2026, TrendForce expected conventional DRAM contract prices to rise 10–15% in October–December 2026 from the quarter before.
- South Korea's chip exports. Samsung and SK hynix make most of them. (shipments and price)
- When: for the first 10 and 20 days of each month, and for the full month. Where: Korea Customs Service.
- Latest: $27.5 billion in October 1–20, 2026, up 222.5% from a year earlier. The 2025 period had fewer working days because of the Chuseok holiday.
- AI spending plans of the largest internet companies. SK hynix's HBM goes into AI chips for their servers. (demand for HBM)
- When: each company's quarterly results. Where: their results releases.
- Latest: for example, on October 21, 2026, Meta put its 2026 capital spending, including finance-lease principal payments, at $135–145 billion and said it expects "to continue investing aggressively" next year.
What Wall Street is asking
Across SK hynix's last four earnings calls, from January to October 2026, analysts kept returning to a few questions.
- "Will new factories, at SK hynix and its rivals, make more memory than buyers need?" In October, SK hynix said 2027 capital spending would rise significantly from 2026, but that it would add capacity only in line with demand and profitability.
- "How much of SK hynix's volume and price do the long-term agreements settle?" In October, SK hynix said the agreements usually run about five years and include deposits. It said its DRAM and HBM volume through 2029 was effectively sold out, including volumes still being negotiated.
- "How fast will HBM4, the newest generation, replace HBM3E, the one before it?" In October, SK hynix said HBM4 would pass HBM3E in both shipments and revenue in October–December 2026, and that HBM4 yield was above plan.
- "Will HBM's profitability catch up with ordinary DRAM's?" In October, Kim Woohyun, the finance chief, said SK hynix had settled 2027 HBM volume and prices with its major customers. He said HBM4's higher value would be reflected in its prices, and that he expects the difference in profitability between HBM and ordinary DRAM to narrow meaningfully.
- "Will AI spending keep growing?" In October, SK hynix said customers' AI investment is leading to wider use of AI services.
A note on valuation
On October 28, 2026, SK hynix's shares in Seoul closed at 1,487,000 won (about US$1,120), up 10.9%. Its market value was about 1,080 trillion won (about US$820 billion). The market value was about 5 times its operating profit for October 2025–September 2026, 200.7 trillion won (about US$138 billion).
Net profit over those quarters, 189.3 trillion won (about US$129 billion), included about 63 trillion won (about US$42 billion) of investment gains in April–June 2026 and about 32.6 trillion won (about US$23 billion) of net losses outside operations in July–September, mostly on investment values and currency. Operating profit leaves those out, so it shows what the memory business earned.
The bottom line
SK hynix's profit is the gap between what memory sells for and what each bit costs to make. Memory is still short, prices are rising fast, and long-term agreements cover over half of its 2027 and 2028 capacity. Whether new factories add memory faster than buyers need it is unknown. (See: TSMC Builds Other People's Chips. It Earns on Being Almost Impossible to Replace.)
Why do memory makers keep building in a boom they expect to end? The book's chapter on memory semiconductors follows SK hynix, Samsung and Micron through the cycle and their efforts to cut the cost of each bit: Earnings Driver.
Sources: SK hynix 3Q26 results (Form 6-K and release, October 28, 2026); SK hynix 2Q26 results (July 2026) and half-year report (Form 6-K, August 2026); SK hynix FY2025 results (January 2026); SK hynix FY2018, FY2019 and FY2023 results; SK hynix registration statement (Form F-1/A, 2026); SK hynix earnings calls of January 29, April 23, July 29 and October 28, 2026; Counterpoint Research (memory market shares for April–June 2026, September 2026 update); TrendForce (press releases of March 31, July 3 and September 30, 2026); Korea Customs Service (October 21, 2026); Meta Q3 2026 results (October 21, 2026); Micron fiscal Q4 2026 earnings call (September 30, 2026); The Elec (2026, Samsung P5); share price as of October 28, 2026 (BusinessKorea, Seoul Shinmun, Financial News); shares outstanding from SK hynix Form F-1/A; exchange rates: Federal Reserve G.5 and G.5A averages for each period, and the H.10 rate of October 23, 2026, for the share price and market value.
For sources that work for any company — filings, earnings calendars, consensus estimates — see Where to find the numbers.
Educational only, not investment advice. Figures as of the periods noted.