Netflix Sells a Monthly Subscription. It Earns by Growing Faster Than Its Content Costs.
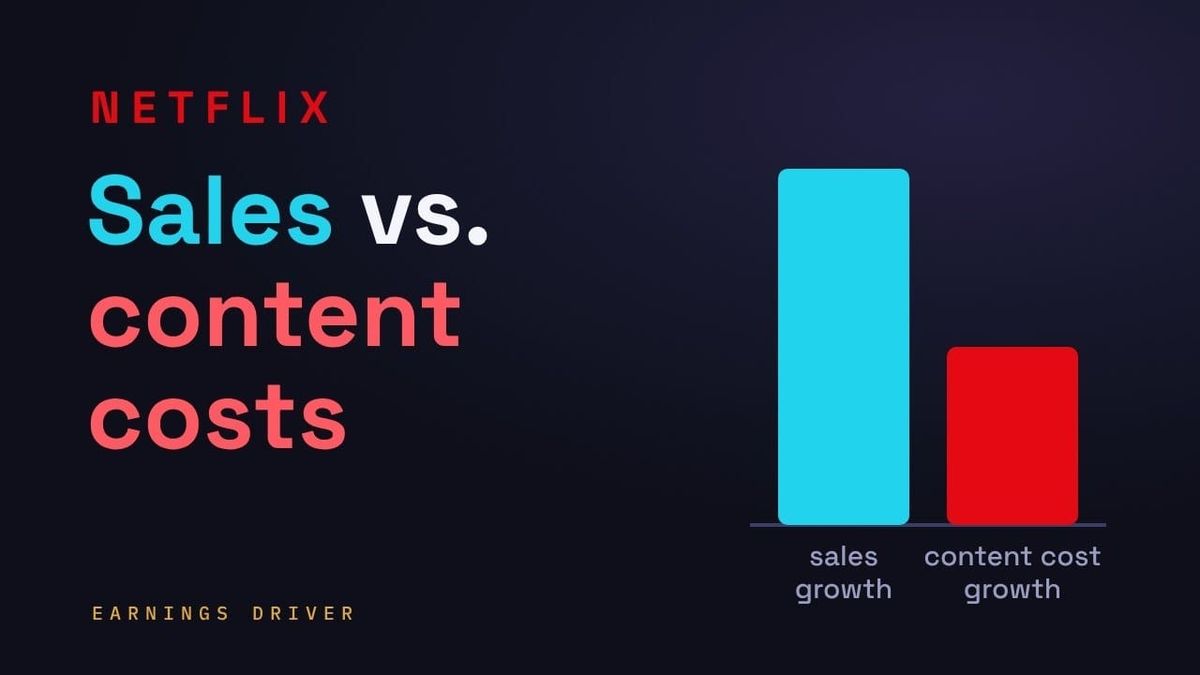
Netflix earns when revenue grows faster than the cost of the new shows it must keep making or licensing. Watch whether revenue grows faster than content amortization, the yearly charge for those shows.
Latest results: What Netflix's Q3 2026 results showed
In one line: Netflix earns when revenue grows faster than the cost of the new shows it must keep making or licensing. Watch whether revenue grows faster than content amortization, the yearly charge for those shows.
At a glance
- Latest: content amortization up 12.5% in Q2 2026, against revenue up 13.4%
- Biggest risk: new shows that draw fewer viewers
- Reports: Quarterly. Next results: see Earnings Dates.
On July 16, 2026, Netflix reported second-quarter revenue of $12.6 billion, up 13% from a year earlier. The last member count Netflix reported was more than 325 million paid memberships, at the end of 2025. More members, higher prices and advertising explain the revenue. Whether Netflix keeps more of that revenue depends mostly on whether its content costs grow more slowly than revenue.
What it sells vs. what it earns on
Netflix sells access to a catalog, by the month, in tiers. In the US, after the March 2026 price increase, the plan with ads costs $8.99, Standard $19.99 and Premium $26.99.
Netflix is available in over 190 countries and regions. Netflix makes series and films in more than 50 countries. Shows in languages other than English drew more than a third of viewing in the first half of 2026. The US and Canada brought in 44% of 2025 revenue.
At the end of 2025, signed content deals not yet on Netflix's books were worth more than half as much as the content already on its books.
Table 1 — Netflix's content, end of 2025
| Content | Amount |
|---|---|
| Produced, incl. in production and development | $20.6B |
| Licensed from others | $12.1B |
| On books, after amortization | $32.8B |
| Signed, not yet on books | $18.4B |
Streaming a show to one more member costs Netflix little. The cost is in the catalog, and it recurs. Netflix expects a show to draw most of its viewing soon after it comes out. Netflix therefore must keep commissioning and licensing new shows to give members a reason to stay.
For a show it produces, Netflix pays most of the cash before the show airs. Netflix then charges the cost against profit over the years the show is expected to draw viewers, most heavily in the first year. That yearly charge, content amortization, was $16.4 billion in 2025, about 36% of revenue.
What Netflix earns on is spreading that cost across more revenue. Netflix decides what to spend on shows largely in advance. Each added member, each accepted price increase and each dollar of advertising therefore adds revenue against a content cost that is already set. What protects the price is a catalog that members do not want to lose. In July 2026, Netflix said its 2026 price increases had gone as expected, as earlier ones did.
What moves the profit
Operating income ≈ (Members × Revenue per member) − Content amortization − Other costs, where revenue per member (Netflix reports it as ARM, average monthly revenue per paying membership) is the subscription price plus advertising, and other costs cover streaming, marketing, technology and overhead
- Members. Paid memberships, which rise with sign-ups and fall with cancellations. Not disclosed each quarter. Regional revenue growth is the closest public measure.
- Price and plan mix. Price increases, and the balance between the cheaper plan with ads and the plans without.
- Advertising. Advertising lets the plan with ads earn more per member than the plan's price.
- Content amortization. The largest cost. Netflix expects content amortization to grow about 10% in 2026. In July, Ted Sarandos, one of its two chief executives, said that rate was above the 8% a year of the past five years and below the 14% a year of the past decade.
Reading the earnings: what to watch, and how
Netflix's shareholder letters and earnings interviews, recorded videos in which management answers analysts' questions, are at ir.netflix.net.
- Revenue growth by region, without currency. Read it: growth that slows right after a price increase can mean members are leaving. Latest: Q2 2026 revenue grew 12% without currency, against 14% in Q1. By region, it grew 10% in the US and Canada (14% in Q1), 11% in Europe, the Middle East and Africa (12%), 16% in Latin America (18%) and 18% in Asia-Pacific (19%).
- Operating margin, against the year-ago quarter and the full-year target. Read it: the fourth quarter usually has the year's lowest margin, so the first three usually are above the full-year target. Compare each quarter with the same one a year earlier, minus one-off items. Latest: 33.4% in Q2 2026, against 34.1% a year earlier and a full-year target of 31.5%. Q3 is guided to 33.2%, against 28.2% in Q3 2025, when a Brazilian tax expense of about $619 million lowered the margin by more than five percentage points.
- Content amortization, growing slower or faster than revenue. Read it: compare its growth with revenue growth; amortization appears in the cash flow statement. Latest: $4.3 billion in Q2 2026, up 12.5% from a year earlier, against revenue up 13.4%.
- Free cash flow against net income. Read it: free cash flow well below net income for several quarters can mean cash spent on content is larger than content amortization, or that taxes paid in cash are high. Netflix plans cash content spending of about 1.1 times content amortization in 2026. Latest: free cash flow was $5.1 billion in Q1 2026 and $1.5 billion in Q2, against net income of $5.3 billion and $3.4 billion. Q1 included a $2.8 billion Warner Bros. Discovery fee for ending its planned sale to Netflix, and Q2 higher cash taxes, partly on that fee.
- Advertising revenue. Read it: Netflix gives ad revenue for the year, not each quarter, so compare the yearly figure with Netflix's yearly forecast. Latest: more than $1.5 billion in 2025, about $3 billion expected in 2026. The plan with ads took over 60% of sign-ups in Q1 2026 in the countries that offer it.
Leading indicators (outside Netflix's filings)
- Share of US TV viewing. Nielsen, a company that measures TV audiences, reports each streaming service's share of all TV time in the US every month. Netflix's share can then be compared with YouTube's. (attention)
- When: monthly, about six weeks after the month ends. Where: Nielsen, The Gauge and the Media Distributor Gauge. Nielsen is changing its method in fall 2026, so compare months measured the same way.
- Latest: in July 2026, Netflix had 7.8% of all US TV time in Nielsen's Media Distributor Gauge, down from 8.8% a year earlier. In Nielsen's The Gauge, a separate measure, YouTube had a record 14.2%.
- Netflix's weekly Top 10. Titles that stay on the list for weeks are still drawing viewers. From 2027 Netflix will publish its engagement report, which gives hours for nearly every title, once a year instead of twice. The weekly list will then be the main public view of viewing between reports. (content)
- When: weekly. Where: top10.netflix.com, where a view is hours watched divided by running time.
- Latest: in the week of September 21–27, 2026, the top English-language series, Monster: The Lizzie Borden Story, drew 14.5 million views in its second week, up from 12.1 million. But the first week counted only the four days after its Thursday release, so viewing per day fell by about a third.
What Wall Street is asking
Across Netflix's last four earnings interviews, from October 2025 to July 2026, analysts kept returning to a few questions.
- "Does slower growth in Netflix's viewing hours mean slower growth in members and revenue per member?" Netflix viewing hours grew about 2% in the first half of 2026. In July, Greg Peters, Netflix's other chief executive, said "there is not a linear relationship between view hours and revenue and profit because all hours are not created equal."
- "How long can price increases keep revenue growing?" In July, Peters said Netflix sees "improvements in value delivered" well before it raises prices. In July, asked separately about slower revenue growth in the third quarter, Spence Neumann, the chief financial officer, said Netflix is "under 45% penetrated into addressable households around the world." That is, Netflix's members make up less than 45% of the households it could reach.
- "Can the plan with ads earn as much per member as Standard?" In July, Peters said, "there's still a gap between ad tier ARM and then ARM for our standard without ads tier. But that gap is narrowing." He said Netflix's own ad technology and added measurement increase the share of ad slots sold, which raises ARM on the plan with ads.
- "Will Netflix speed up content spending?" In July, Sarandos said, "We grow the content spend slower than revenue while we're continuing to invest in a huge addressable market."
- "Will Netflix buy studios instead of making its own shows?" In December 2025, Netflix agreed to buy Warner Bros. Discovery's studios and its HBO Max streaming service. The deal ended in February 2026, when Warner Bros. Discovery accepted an offer from Paramount. In July, Sarandos said "we have a very high bar to do any big M&A," meaning mergers and acquisitions.
A note on valuation
At about $67 a share on October 2, 2026, Netflix's market value was roughly $285 billion. At the end of June 2026, Netflix had about $14.3 billion in borrowings and about $9.1 billion in cash. Netflix's enterprise value was about $290 billion, or about 18 times the 2026 operating income implied by Netflix's forecasts. From 2021 to 2025, the same measure at the end of June ranged from about 15 to 43 times that year's operating income. Netflix expects operating income to grow more than 20% in 2026.
The bottom line
Each added member, price increase and ad dollar adds revenue against content costs Netflix sets largely in advance. In April–June 2026, revenue still grew slightly faster than content amortization. The test is whether new shows keep drawing enough viewers for that to last. (See: Costco Sells Groceries Near Cost. It Earns on Members Who Renew.)
Wondering why one subscription earns so differently from another? The book sets Netflix beside Adobe, which is still paid for software it wrote years ago: Earnings Driver.
Sources: Netflix shareholder letters for Q3 2025 to Q2 2026 and earnings interviews of October 21, 2025, January 20, 2026, April 16, 2026 and July 16, 2026 (ir.netflix.net); Netflix 2025 Form 10-K; Netflix engagement report for the first half of 2026 (July 16, 2026); Netflix Help Center (countries, October 2026); US prices as reported March 2026; Nielsen The Gauge and Media Distributor Gauge, July 2025 and July 2026; Netflix Top 10, weeks of September 14 and 21, 2026; share price as of October 2, 2026; past market values from Netflix's 2021–2025 Form 10-K cover pages.
For sources that work for any company — filings, earnings calendars, consensus estimates — see Where to find the numbers.
Educational only, not investment advice. Figures as of the periods noted.