Disney Is Known for Its Movies. It Earns More on Parks, Cruises and Consumer Products.
Disney earns on characters from its films and shows, through theme parks, hotels, cruise ships and consumer products. Watch whether US park attendance and spending per guest grow, and whether the streaming operating margin rises.
In one line: Disney earns on characters from its films and shows, through theme parks, hotels, cruise ships and consumer products. Watch whether US park attendance and spending per guest grow, and whether the streaming operating margin rises.
At a glance
- Latest: US park attendance up 3% and spending per guest up 4% in fiscal Q3 2026 (April–June 2026), against −1% and +5% in fiscal Q2 2026 (January–March 2026); streaming operating margin 12.9%, against 6.6% a year earlier
- Biggest risk: fewer international visitors to the US parks and weaker demand at the parks in Asia, while Disney's capital spending rises
- Reports: quarterly; Disney's fiscal year ends in late September or early October. Next results: see Earnings Dates.
On August 5, 2026, Disney reported revenue of $25.2 billion for its fiscal third quarter, which ran from April to June, up 7% from a year earlier. Its Experiences segment, which runs the parks, hotels, cruise ships and consumer products, earned $3.0 billion of Disney's $5.6 billion in segment operating income. Segment operating income is the profit of Disney's businesses before head-office costs, interest, taxes, one-time charges and the amortization of past acquisitions. Disney's film and streaming revenue does not explain why more than half of Disney's segment operating income comes from parks, hotels, ships and consumer products.
What it sells vs. what it earns on
Disney reports three segments. Entertainment makes films and TV shows, runs TV networks such as ABC and FX, and sells subscriptions to Disney+ and Hulu. Sports is ESPN: its TV networks and its streaming service. Experiences runs the parks, hotels and cruise ships. It also runs consumer products: licensing Disney characters to companies that make toys, clothes and other goods, and selling through Disney's own stores.
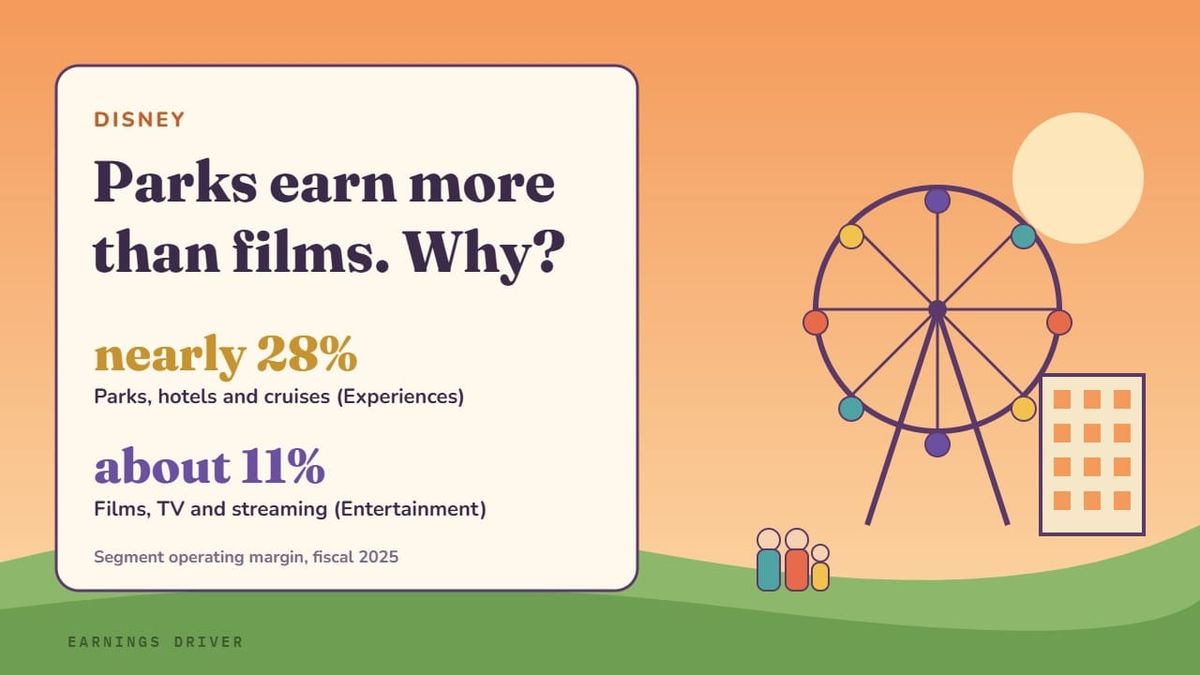
In fiscal 2025 (October 2024–September 2025), Experiences brought in 38% of Disney's $94.4 billion in revenue but 57% of its $17.6 billion in segment operating income.
Table 1 — Disney's segments, fiscal 2025
| Segment | Revenue | Segment operating income | Margin |
|---|---|---|---|
| Entertainment | $42.5B | $4.7B | 11.0% |
| Sports | $17.7B | $2.9B | 16.3% |
| Experiences | $36.2B | $10.0B | 27.6% |
Segment revenues add up to more than Disney's total because sales between segments are removed from the total.
Disney's 12 theme parks are in six resorts.
Table 2 — Disney's theme park resorts
| Resort | Parks | Disney's stake |
|---|---|---|
| Walt Disney World, Florida | 4 | 100% |
| Disneyland Resort, California | 2 | 100% |
| Disneyland Paris | 2 | 100% |
| Hong Kong Disneyland | 1 | 48% |
| Shanghai Disney Resort | 1 | 43% |
| Tokyo Disney Resort | 2 | None |
Tokyo Disney Resort is owned by Oriental Land, which pays Disney a royalty.
Disney ran eight cruise ships in fiscal Q3 2026 (April–June 2026), two more than before November 2025. It plans four more by 2031.
In September 2023, Disney said it planned to spend about $60 billion over about ten years on Experiences, nearly double the previous ten years. Disney's capital spending was $8.0 billion in fiscal 2025, about four-fifths of it in Experiences. Disney expects about $9 billion in fiscal 2026 (October 2025–September 2026).
Consumer products, which licenses Disney's characters, had the highest margin in Experiences, 49% in fiscal 2025.
From fiscal 2027 (October 2026–September 2027), Disney will move much of consumer products from Experiences to Entertainment. Without consumer products, the parks, hotels and ships earned about 45% of segment operating income in fiscal 2025 and 49% in the first nine months of fiscal 2026 (October 2025–June 2026).
What moves the profit
Operating income ≈ (Guests × Spending per guest − Park, hotel and cruise costs) + Consumer products + Entertainment operating income + Sports operating income − Corporate overhead − Amortization of past acquisitions
- Guests. Park visits, hotel room nights and cruise days. Disney reports the percentage change in US park attendance and global guests, not the counts.
- Spending per guest. What guests spend on tickets, food, drinks, merchandise, rooms and cruises. For park visitors, Disney calls it per capita spending. Disney measures hotel spending separately. For its US parks, it reports the percentage change in per capita spending (tickets, food, drinks and merchandise).
- Park, hotel and cruise costs. Staff, maintenance and depreciation of rides, hotels and ships. Disney's quarterly filing breaks them down by type.
- Entertainment operating income. Streaming subscriptions and advertising, TV network fees and advertising, and film and TV sales, minus content and marketing costs.
- Sports operating income. ESPN's fees from TV distributors and subscribers, plus advertising, minus the cost of sports rights.
Reading the earnings: what to watch, and how
Disney's results releases, filings and earnings calls are all at thewaltdisneycompany.com/investor-relations.
- Experiences operating income and margin. Read it: new rides and ships add pre-opening costs and depreciation before their guest numbers build up. Latest: $3.0 billion in fiscal Q3 2026 (April–June 2026), up 20% from a year earlier, at a 30.3% margin against 27.7%. Operating income at the international parks fell 13%, which Disney attributed to softness at its parks in Asia.
- US park attendance and spending per guest. Read it: spending per guest rising while attendance falls means growth comes from higher prices and more purchases per visit, not from more guests. Latest: attendance +3% and spending per guest +4% in fiscal Q3 2026, against −1% and +5% in fiscal Q2 2026 (January–March 2026). Together, guests spent about 7% more at the US parks than a year earlier. Revenue for the whole US parks business, which also includes the hotels and Disney Cruise Line, rose 11% to $7.1 billion.
- Streaming operating margin. Read it: Disney stopped reporting subscribers in fiscal 2026 (October 2025–September 2026), so the operating margin of Disney+ and Hulu, reported as Entertainment SVOD (subscription video on demand), is its main streaming measure. Latest: $712 million of operating income at a 12.9% margin in fiscal Q3 2026, against $329 million and 6.6% a year earlier. Disney said part of the gain came from the timing of marketing and programming spending.
- Sports operating income. Read it: ESPN's rights costs vary with the sports season, so compare with the same quarter a year earlier, and check whether Disney says a contract moved costs between quarters. Latest: $858 million in fiscal Q3 2026, down 17% from a year earlier. Disney said the renewed NBA contract moved costs into fiscal Q3 2026 and also cited short early-round playoff series and a dispute with a TV distributor.
Leading indicators (outside Disney's filings)
- Overseas visitors to the US. Since February 2026, Disney has named fewer international visitors as a headwind at its US parks. (demand)
- When: monthly. Where: US International Trade Administration, international visitor arrivals.
- Latest: in July 2026, arrivals from overseas countries (all except Canada and Mexico) fell 7.0% from a year earlier. Arrivals from all countries were only 0.1% lower, because visitors from Canada and Mexico rose.
- Orlando hotel tax. Orange County, Florida, contains most of Walt Disney World. The county collects a tax on hotel stays across the county, including at hotels run by Universal, a rival theme park business. Collections reflect rooms filled and room prices. (demand)
- When: monthly, about five weeks after the month ends. Where: Orange County Comptroller, Tourist Development Tax reports.
- Latest: August 2026 collections were 3.2% lower than a year earlier. For October 2025 to August 2026 they were 7.8% higher.
- Universal's theme parks. Comcast, which owns Universal, reports before Disney does. Universal's Orlando parks, including Epic Universe, which opened in May 2025, compete with Walt Disney World. Weak results at Universal and in the hotel tax suggest weaker travel demand. Weak Universal results alone can mean visitors chose Disney. (competition)
- When: quarterly. Where: Comcast results releases.
- Latest: in the second quarter of 2026, Universal's theme park revenue, which also includes its parks outside the US, rose 2.7% from a year earlier. Universal's theme park adjusted EBITDA, a measure of profit before depreciation, fell 5.1%.
What Wall Street is asking
Across Disney's last four earnings calls, from November 2025 to August 2026, analysts kept returning to a few questions.
- "Will park growth come from more guests or more spending per guest?" In August, Josh D'Amaro, chief executive since March 2026, was asked whether new discounts at the US parks meant weak attendance. He said, "we're certainly not discounting our way to volume growth." He said he expected Experiences operating income for fiscal 2026 (October 2025–September 2026) to grow at the high end of Disney's high-single-digit forecast, excluding the extra week. Disney's fiscal 2026 has 53 weeks instead of 52.
- "Can streaming earn as much for Entertainment as licensing the shows to others?" D'Amaro said in August that Disney's streaming margins look "quite similar" to Netflix's when Netflix was at a similar revenue scale.
- "Can ESPN fees and advertising keep up with the cost of sports rights?" In May, Hugh Johnston, Disney's chief financial officer, said Disney has "scale in our most important market," the US. He said Disney had not yet begun early renewal talks with the NFL.
- "Will the $60 billion Experiences plan keep earning good returns?" Johnston said in August that returns on Experiences investment had risen over time. In May he said that even with 40% more cruise capacity, "booked occupancy remains in-line".
- "How much are fewer international visitors and Universal's Epic Universe lowering attendance at the US parks?" In May, Johnston said he expected both effects "to ease in the coming quarters." In August he said Walt Disney World's growth was "almost entirely driven by our own organic actions."
A note on valuation
On October 12, 2026, Disney's shares closed at about $108, valuing the company at roughly $187 billion. The share price was about 17 times Disney's adjusted earnings per share over the previous four quarters. Disney expects to buy back at least $9 billion of its shares in fiscal 2026 (October 2025–September 2026), about 5% of that market value.
The bottom line
Disney's characters earn the most at its parks, on its ships and in its products. In April–June 2026, US park attendance, spending per guest and the streaming operating margin rose from a year earlier. Whether fewer international visitors and weak demand in Asia slow the parks is not yet known. (See: Netflix Sells a Monthly Subscription. It Earns by Growing Faster Than Its Content Costs.)
How does Disney earn on one character again and again, in a film, a ride and a toy? The book's chapter on video games explains how, through Nintendo's Mario: Earnings Driver.
Sources: Disney fiscal Q3 2026 results release and shareholder letter (August 5, 2026), Form 10-Q for the quarter ended June 27, 2026; Disney earnings calls of November 13, 2025, and February 2, May 6 and August 5, 2026; Disney fiscal Q1 and Q2 2026 results releases (February 2 and May 6, 2026); Disney fiscal 2025 results release (November 13, 2025) and Form 10-K for fiscal 2025; Disney Form 8-K on its Experiences investment plan (September 19, 2023); Disney announcement of its new chief executive (February 3, 2026); leading indicators: US International Trade Administration arrivals for July 2026, Orange County Comptroller Tourist Development Tax report for August 2026 (October 6, 2026), Comcast second-quarter 2026 results (July 23, 2026); share price as of October 12, 2026.
For sources that work for any company — filings, earnings calendars, consensus estimates — see Where to find the numbers.
Educational only, not investment advice. Figures as of the periods noted.